Table of Contents
Understanding Denkiya's Cost and Savings Estimates
Denkiya helps you understand the true cost of running your home and vehicles on electricity versus fossil fuels. This page explains how we calculate the energy costs, vehicle and appliance running costs, and savings estimates you see in the app.
We want you to feel confident knowing exactly how the numbers are derived, using real-world energy prices and industry-standard efficiency data.
Calculating Energy Costs
Denkiya uses publicly available energy price data, primarily from the U.S. Energy Information Administration (EIA), to estimate what you pay for different fuels. We use the most recent full year of data for stability and consistency to provide you regionally accurate, data-driven comparisons across fuel types. Rates can vary seasonally; our displayed numbers typically reflect average, minimum, and/or maximum values for your state and calculated costs are rounded to the nearest cent for clarity and consistency.
Where monthly rate data is available, we also calculate an estimated annual cost that goes beyond a simple average. Rather than multiplying a single average rate by annual usage, we price each month of energy consumption at that month's actual observed rate, then sum the twelve monthly totals. This means the estimated figure reflects real seasonal rate swings—months where electricity is more expensive in summer, for example—rather than smoothing them out. When you see an estimated value alongside an average range, the estimate is derived from this month-by-month observed calculation and will often be the most accurate single-point figure for your situation.
Electricity
- We use average residential electricity rates for your State.
- Prices are reported in cents per kWh and converted to dollars per kWh.
Example:
If your state's average rate is 10.4¢/kWh → $0.10/kWh.
Natural Gas
- We use average residential Natural Gas rates for your State.
- Prices are reported in dollars per thousand cubic feet (MCF).
- We convert this to cost per therm (1 MCF ≈ 10.37 therms).
Example:
$3.00/MCF → $0.29 per therm.
Gasoline & Diesel
- We use your regional price for regular gasoline or no 2 diesel by PADD region, state or metro area when available. In the rare event that none of the above is available we fall back to the national average for that fuel type.
- Prices are reported in dollars per gallon.
Example:
National average = $3.07/gallon.
Propane
- We use the residential pricing for your PADD region price for propane, falling back to the national average when a PADD price is unavailable.
- Due to the warmer climate and a resulting lack of consistent, statistically significant pricing data, PADD 5 (West Coast) is excluded from the reported EIA dataset for this fuel type.
- Prices are reported in dollars per gallon, which is how propane is typically sold and delivered to homes.
- We store and use those EIA prices in dollars per gallon (natural gas alone is normalized to dollars per therm).
- For context, propane contains approximately 91,500 BTUs per gallon, or about 0.915 therms per gallon of energy content.
Example:
National average = $2.50/gallon, stored and shown as $2.50/gallon.
Heating Oil
- We use the residential pricing for your PADD region price for heating oil, falling back to the national average when a PADD price is unavailable.
- Due to the warmer climate and a resulting lack of consistent, statistically significant pricing data, PADD 5 (West Coast) is excluded from the reported EIA dataset for this fuel type.
- Prices are reported in dollars per gallon, which is how heating oil is typically sold and delivered to homes.
- We store and use those EIA prices in dollars per gallon (natural gas alone is normalized to dollars per therm).
- For context, heating oil contains approximately 138,500 BTUs per gallon, or about 1.385 therms per gallon of energy content.
Example:
National average = $3.48/gallon, stored and shown as $3.48/gallon.
Calculating Savings
Across all vehicle and appliance types, savings are calculated the same way: by comparing the annual running cost of your current setup to the annual running cost of a comparable alternative. A positive savings value means your current option is cheaper to run; a negative value means the alternative would cost less at your current rates.
Formula:
Savings = Comparison annual cost − Your annual cost
The Savings Range: Low, Average, and High
Because energy rates aren't a single fixed number—they vary by tier, season, and data source—we present savings as a range rather than a single figure. Each savings result includes a low end, a high end, and an average:
- Average (avg): Savings calculated using the average rate for each fuel type. This is the most representative single figure for most households.
- Low end: The worst-case savings scenario—the cheapest available comparison rate minus the most expensive primary rate. This represents the least favorable combination of rates for switching.
- High end: The best-case savings scenario—the most expensive comparison rate minus the cheapest primary rate. This represents the most favorable combination of rates.
By using this cross-rate approach for the endpoints, the average savings figure is always guaranteed to fall within the low-to-high range, giving you a spread that honestly represents the realistic range of outcomes for your area rather than a single point that might mask rate variability.
Estimated vs. Average Savings
Where monthly rate data is available, we also compute an estimated savings figure using the same month-by-month observed-rate approach described in the energy costs section above. Rather than applying a single average rate to the full year, we calculate each month's cost at that month's actual rate and sum the results for both sides of the comparison. The estimated figure therefore reflects real seasonal variation and is generally the most accurate single-point savings value when monthly data is available.
A Note on Direction
The sign of savings depends on which option is the primary and which is the comparison. For example, an electric vehicle primary compared to a gasoline equivalent shows positive savings when electricity is cheaper per mile; a gas cooktop primary compared to an induction baseline shows positive savings when gas is cheaper per session in your area. The direction can flip depending on local rates, so always consider what the comparison pairing is when interpreting a result.
Back to topAdding Your Own Energy Data
While Denkiya provides regionally accurate energy cost estimates using publicly available data, you can also add your own energy data for even more personalized calculations. This feature allows you to input your actual monthly electricity, natural gas, gasoline, diesel, propane, or heating oil costs to get more accurate estimates for your specific situation.
How to Add Custom Data
Click the “Add My Energy Data” button in the “My Energy Costs” section to enter your monthly energy consumption and costs. You can input up to 12 months of data for any energy source. The system will automatically calculate your annual average, high, and low costs based on your actual usage patterns.
Two Ways to Add Your Data
Manual Entry
Enter your most recent full year's worth of utility data manually by filling in the monthly consumption (kWh, therms, gallons, etc.) and cost fields. This method works for all energy sources and all utility companies and vendors. Simply gather your monthly utility bills or reciepts and enter the usage and cost data for each month.
Green Button Upload
For supported utilities, you can download your energy data directly from your utility's website using the Green Button standard and upload the ZIP file to automatically populate your data. This saves time and reduces manual data entry errors.
How to download your Green Button data:
- Sign in to your utility's online account
- Look for “Usage Details” or “Green Button: Download my data”
- Select a date range (we recommend at least 12-24 months for accurate calculations)
- Choose CSV format and download the ZIP file
- Upload the ZIP file in Denkiya's “Add My Energy Data” modal
Solar Energy Considerations
If you have solar panels, your electricity costs may include net metering credits or negative values during months when you generate more electricity than you consume. When you add custom electricity data and have solar panels installed, Denkiya will display a single annual average cost instead of a range. This is because the high and low monthly values for solar users often include extreme variations (including negative costs during sunny months) that don't represent your true annual electricity cost.
Example: A solar user might see monthly costs ranging from -$50 (credit) to $200 (winter months), but their true annual average might be $75. In this case, we show $75 as the single cost rather than a misleading range.
True-up Billing: Many solar customers are on net metering plans with annual “true-up” billing cycles. Throughout the year, you may pay only minimum charges (often $10-20/month), but then receive a large bill at the end of the billing cycle to settle the difference between your consumption and generation. Simply enter your actual monthly bills as they appear, including any true-up charges in the month they occur. Denkiya will automatically calculate the correct annual average cost based on your total annual consumption and costs.
Important: If you're on net metering, make sure to include your true-up bill when entering your custom data. If you only enter the minimum monthly charges and omit the true-up amount, your per-kilowatt-hour cost will be artificially low and won't reflect your actual electricity costs.
Example: If you have 11 months of $15 minimum charges and one month with a $600 true-up bill, enter these amounts exactly as they appear on your bills. The system will calculate your true annual average cost from the total annual amount.
Outlier Detection & Data Filtering
When you upload your energy data, Denkiya automatically applies robust statistical filtering to identify and exclude extreme outliers that could skew your cost estimates. This ensures that one-off billing errors, credits, or unusual circumstances don't distort your representative high and low cost ranges.
How it works: We calculate monthly rates (cost ÷ usage) and use an asymmetric Interquartile Range (IQR) method to identify outliers. The system is more lenient with low rates (allowing legitimate seasonal lows) but stricter with high rates (catching billing errors or extreme spikes). This means a $0.30/kWh rate during a low-usage month will be included, while a $0.95/kWh billing error will be excluded.
What gets filtered: Extreme outliers like billing errors, one-time credits, or unusual circumstances that don't represent your typical energy costs. Normal seasonal variations and legitimate low/high rates are preserved.
Result: You get realistic high and low cost ranges that reflect your actual energy usage patterns, not distorted by billing anomalies or data entry errors.
Data Accuracy Disclaimer
Important: The accuracy of your cost estimates and savings calculations depends entirely on the quality and completeness of the data you provide. Please ensure that:
- Your monthly consumption and cost data is accurate and complete
- You include all relevant energy sources you use
- Your data represents a typical year of usage (accounting for seasonal variations)
- You update your data if your energy usage patterns change significantly
Denkiya will always prioritize your custom data over regional averages when available, but remember that “garbage in, garbage out” applies - the more accurate your input data, the more reliable your cost estimates and savings projections will be.
Back to topEstimating Baseline Home Electricity
Denkiya is built around the categories where fuel switching matters most—vehicles, heating, hot water, dryers, cooking, and similar. Your Annual Costs & Energy chart reflects those appliances and how you use them, priced at your local rates.
Most homes also have a layer of everyday electric use behind that: lights, the fridge, outlets, and small kitchen gadgets that are already electric and aren't where the big electrification wins usually show up. We don't model each of those devices on its own. Instead, a simple baseline home electricity estimate fills in that backdrop. On the chart it appears as Lighting, Refrigeration, and Other Loads (marked est.).
Where Denkiya Focuses
Denkiya is primarily built around vehicles and appliances where switching away from fossil fuels can deliver meaningful savings—heating, cooling, hot water, driving, laundry, and cooking. Those are the categories we model in detail because they're where fuel choice usually matters most.
Baseline electricity is the backdrop behind that picture: representative defaults for loads that are already electric and rarely the main story in an electrification decision. Microwaves, coffee makers, phone chargers, and similar plug-in devices roll into plug-load estimates—we do our best to size them sensibly for a typical home, but we're not aiming for item-by-item precision there.
The defaults are meant to be useful out of the box. If you know your actual usage for any baseline category, you can enter it on Home Setup and the chart will follow your numbers instead.
What We Include
The baseline model covers the kinds of electricity use that show up in almost every home, broken into a few everyday categories:
- Refrigeration — a typical modern refrigerator and freezer.
- Lighting — interior and exterior lighting, scaled to your home's size.
- Dishwasher — the electric side of dishwashing (motor and controls), even when the water is heated by gas.
- Plug loads — TVs, chargers, small appliances, and other outlets that are always drawing some power.
- Clothes washer — Clothes washers are always electric, so Denkiya does not ask you to add a washer as its own appliance the way we do for a clothes dryer. Washer electricity lives here in baseline electricity instead: a modest default for most homes, or—when you've added a dryer—an estimate tied to the same laundry habits. To change or exclude it, use the Baseline Electricity card on Home Setup; there is no separate washer card elsewhere in the app.
- Gas-appliance standby — small amounts of electricity used by gas furnaces, water heaters, ranges, and similar equipment for pilots, ignition, and controls.
Loads you have modeled separately—your HVAC, dryer, vehicles, and so on—stay on their own chart segments. The baseline is meant to fill in the rest, not double-count them.
How We Size the Estimate
We start from your home details—mainly square footage and number of occupants—and apply representative annual usage for each category. Larger homes get more lighting and plug-load electricity; more people add a bit more device and outlet use. If square footage isn't on file, we infer a reasonable default from bedroom count.
The result is a bottom-up estimate tuned to feel realistic for a typical U.S. home, then gently bounded so the total stays within a sensible range. It's informed by national home energy survey patterns, but it is not a full home energy audit—think of it as a thoughtful starting point, not a meter reading.
Make It Yours on Home Setup
On the Home Setup page, the Baseline Electricity card shows these estimates line by line. You can edit any annual kWh value if you know your actual usage, turn off a category you don't have (for example, no dishwasher), or restore our default for a row at any time.
When you save changes there, the chart and your household totals update to match. Custom values are remembered for your home; excluded loads are treated as not applicable rather than zero usage.
What is a PADD Region?
A Petroleum Administration for Defense District (PADD) is a geographic region defined by the U.S. government to help track and analyze petroleum distribution and pricing. Originally established during World War II, PADDs are still used today to organize and report fuel price data regionally, making comparisons more meaningful than national averages alone.
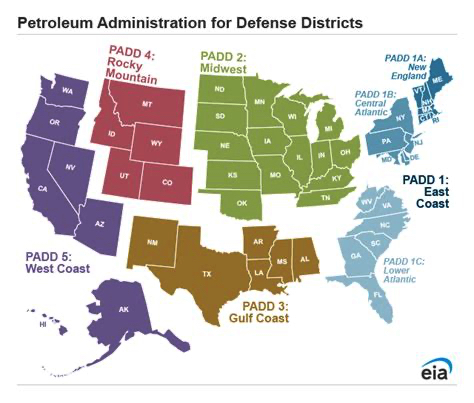
PADD Regions
| PADD | Region Name | States |
|---|---|---|
| PADD 1A | New England | CT, ME, MA, NH, RI, VT |
| PADD 1B | Central Atlantic | DE, DC, MD, NJ, NY, PA |
| PADD 1C | Lower Atlantic | FL, GA, NC, SC, VA, WV |
| PADD 2 | Midwest | IL, IN, IA, KS, KY, MI, MN, MO, NE, ND, OH, OK, SD, TN, WI |
| PADD 3 | Gulf Coast | AL, AR, LA, MS, NM, TX |
| PADD 4 | Rocky Mountain | CO, ID, MT, UT, WY |
| PADD 5 | West Coast | AK, AZ, CA, HI, NV, OR, WA |
| PADD 5 Except California | West Coast except CA | AK, AZ, HI, NV, OR, WA |
Calculating Vehicle Running Costs
We help you compare the cost of driving an electric vehicle (EV), a gasoline vehicle, or a plug-in hybrid by first calculating cost per mile for each vehicle type.
Electric Vehicles
Watt hours per mile tells you how many watt-hours you use to travel 1 mile and is a common metric used to measure EV efficiency. For our purposes however Miles per Kilowatt Hour (mi/kWh) tells you how many miles you can travel per 1 kilowatt-hour of stored electricity and is a cleaner analogue to Miles Per Gallon.
Since 1 kWh = 1000 Wh, you divide 1000 by Wh/mile.
Examples:250 Wh/mile → 1000 ÷ 250 = 4.0 mi/kWh300 Wh/mile → 1000 ÷ 300 ≈ 3.33 mi/kWh
Formula:
Cost per mile = Electricity cost per kWh ÷ Vehicle efficiency (miles per kWh)
Example:
$0.12/kWh ÷ 3.5 mi/kWh = $0.03 per mile
Gasoline and Hybrid Vehicles
For gasoline and hybrid vehicles we use the same basic formula, but with the cost of gasoline or diesel per gallon instead.
Formula:
Cost per mile = Gasoline cost per gallon ÷ Vehicle efficiency (miles per gallon)
Example:
$4.00/gallon ÷ 25 mpg = $0.16 per mile
Plug-in Hybrid Vehicles
For plug-in hybrid vehicles we use a blended cost per mile formula that combines the cost of electricity and gasoline. You adjust the slider to indicate what % of the time you drive on gasoline vs. electric only miles.
Formula:
Blended cost per mile = (Electric cost per mile × Electric fraction) + (Gas cost per mile × Gas fraction)
Example:
($0.03 × 0.6) + ($0.16 × 0.4) = $0.08 per mile
Public Charging Adjustment
We apply a 2.5x max multiplier for public charging: 1 + (Public charging % ÷ 100) × 1.5 to account for the higher cost of charging at public stations. Becuase public charging costs may vary greatly depending on location and station host, etc. this multiplier is a rough approximation and may not reflect your actual local public charging costs.
Example:
20% public charging: $0.034 × 1.3 = $0.044 per mile
Calculating Vehicle Savings
Savings are calculated by comparing the average annual cost of driving an electric vehicle (EV) to the average annual cost of driving a comparable gasoline vehicle. Average annual cost is calculated by multiplying the cost per mile by your annual mileage in each case.
Formula:
Annual cost = Cost per mile × Annual mileage
Example:
$0.03 per mile × 15,000 miles/year = $450/year
Estimated savings: Gas equivalent vehicle annual cost – Electric vehicle annual cost
Example:
$1,920 (gas) – $528 (electric) = $1,392 saved per year
Calculating Dryer Savings
Dryer savings are calculated by comparing the annual cost of running your electric dryer to the annual cost of running a comparable gas dryer with the same usage patterns. This comparison helps you understand the cost difference between electric and gas drying methods.
Electric Dryer Costs
For electric dryers, we calculate the cost per load using your dryer's efficiency rating (Combined Energy Factor or CEF) and electricity rates. Energy Star uses Combined Energy Factor (CEF) to directly compare the energy efficiency of gas and electric clothes dryers in pounds per kWh. The higher the value, the more efficient the dryer is. To determine a dryer's CEF, you can visit Energy Star's website.
Formula:
Cost per load = kWh per load × Electricity rate per kWh
Example:
2.5 kWh per load × $0.12/kWh = $0.30 per load
Gas Dryer Costs
For gas dryers, we calculate the cost per load using both gas and electricity consumption (gas dryers still use electricity for the motor and controls). The CEF rating combines both electricity and gas usage, but since electricity and gas have different rates, we need to split these out for an accurate cost calculation.
We start with the CEF rating, then subtract the electricity usage (motors, controls) at your local electricity rate. The remaining energy represents gas usage, which we convert from kilowatt-hours to therms using your local gas rate. This ensures we don't double-count electricity usage and accurately calculate the cost of both fuel types:
Formula:
Cost per load = (kWh per load × Electricity rate) + (Therms per load × Gas rate per therm)
Example:
(0.25 kWh × $0.12/kWh) + (0.11 therms × $1.81/therm) = $0.03 + $0.20 = $0.23 per load
Annual Cost Calculation
We then calculate annual costs based on your usage patterns:
Formula:
Annual cost = Cost per load × Loads per day × 365 days
Example:
$0.30 per load × 3 loads/day × 365 days = $328.50 per year
Savings Calculation
Savings are calculated by comparing your electric dryer's annual cost to a gas dryer's annual cost:
Formula:
Annual savings = Gas dryer annual cost – Electric dryer annual cost
Example:
$251.85 (gas) – $328.50 (electric) = -$76.65 (you pay more with electric)
When the result is negative, it means your electric dryer costs more to run than a comparable gas dryer. When positive, it means you're saving money with your electric dryer. Which option is cheaper depends on your local electricity and gas rates—in some areas gas is cheaper, in others electric is.
Key Factors
- Dryer Efficiency: More efficient dryers (like heat pump dryers) use less energy per load
- Local Energy Rates: Electricity and gas prices vary significantly by region
- Usage Patterns: Number of loads per day and load size affect total annual costs
- Dryer Type: Heat pump dryers are typically more efficient than resistance electric dryers
Calculating Hot Water Heater Costs and Savings
Hot water heater costs and savings are calculated by comparing the annual cost of running your water heater (electric or gas) to the annual cost of a comparable unit using a different fuel or technology—for example, an efficient electric heat pump water heater versus a natural gas or propane unit. We use your household's hot water usage, your location's cold water inlet temperature, and industry-standard efficiency ratings (UEF) to estimate daily energy use, then apply your local electricity and gas rates to produce cost-per-day and annual estimates.
Calculating Daily Energy Use
We first determine how much energy the water heater must deliver each day, then account for efficiency and fuel type. Cold water enters the heater at an average temperature that depends on your state (from public groundwater data). The heater raises it to a distribution temperature (e.g. 120°F); at the tap you mix hot with cold to reach a typical use temperature (e.g. 105°F). That mixing reduces the effective demand. We use the following steps:
- Temperature rise (ΔT): The difference between the hot water temperature at the heater and the inlet cold water temperature:
ΔT = Distribution hot temp (°F) − Inlet cold water temp (°F). - Raw thermal demand: The energy needed to heat the water you use each day (before mixing and efficiency):
Raw BTU/day = ΔT × 8.34 × Gallons per day. The 8.34 factor is the BTU required to heat one gallon of water by 1°F. - Mix multiplier: Because you mix hot water with cold at the tap, you don't need to heat every gallon to full hot. We use
Mix multiplier = (Tap mix temp − Inlet temp) ÷ ΔT, clamped to a reasonable range (0 to 1.2). - Adjusted input energy: We divide by the unit's efficiency (Uniform Energy Factor, or UEF) so that less efficient units use more input energy for the same delivered hot water:
Adjusted input BTU/day = (Raw BTU/day × Mix multiplier) ÷ UEF. The higher the UEF, the more efficient the water heater.
From adjusted input BTU/day we then split energy into electricity (kWh/day) and/or gas (therms/day) depending on fuel type, and apply your local rates.
Electric Water Heater Costs
For electric water heaters (including resistance and heat pump units), all heating energy is electricity. We convert adjusted input BTU to kilowatt-hours using the standard conversion (1 kWh = 3,412 BTU), then apply your electricity rate.
Formula:
kWh per day = Adjusted input BTU per day ÷ 3,412
Cost per day:
Daily cost = kWh per day × Electricity rate per kWh
Example:
12 kWh/day × $0.12/kWh = $1.44 per day → about $525 per year
Gas Water Heater Costs (Natural Gas & Propane)
Gas water heaters use gas for most of the heating but also use a small amount of electricity for the pilot, ignition, and controls. We subtract that parasitic electricity (in BTU) from the adjusted input BTU; the remainder is supplied by gas and converted to therms (1 therm = 100,000 BTU). We then calculate the cost of both the electricity and gas at your local rates.
Formula:
Gas BTU per day = Adjusted input BTU per day − (Baseline kWh per day × 3,412)
Therms per day = Gas BTU per day ÷ 100,000
Cost per day:
Daily cost = (kWh per day × Electricity rate) + (Therms per day × Gas rate per therm)
Example:
(0.15 kWh × $0.12/kWh) + (0.45 therms × $1.50/therm) = $0.02 + $0.68 = $0.70 per day → about $255 per year
Annual Cost and Cost per Day
We display both a cost per day and an estimated annual cost. When monthly electricity or gas rates are available, we use them to build a month-by-month estimate; otherwise we use your average daily cost × 365.
Formula:
Annual cost = Cost per day × 365 days
Savings Calculation
Savings are calculated by comparing your primary water heater's annual cost to the annual cost of a comparable unit using a different fuel or technology (e.g. electric heat pump vs. natural gas, or gas vs. electric). We use the same daily hot water usage and location so the comparison is apples-to-apples.
Formula:
Annual savings = Comparison unit annual cost − Your unit annual cost
Example:
$525 (electric heat pump) − $255 (gas) = $270 more per year with electric in this example. When the result is negative, your current unit costs less to run than the comparison; when positive, the comparison unit would cost more. Which option is cheaper depends on your local electricity and gas rates and on the efficiency (UEF) of each unit.
Key Factors
- Uniform Energy Factor (UEF): Higher UEF means less energy input for the same hot water delivered. Heat pump electric units typically have higher UEF than resistance electric; gas units vary by age and type.
- Inlet water temperature: Colder groundwater (e.g. northern states) increases the temperature rise required and thus daily energy use.
- Hot water usage: Gallons per day (or occupants and per-person defaults) drive raw demand. More usage means higher cost.
- Local energy rates: Electricity and gas prices vary by region, so the same unit can cost more or less depending on where you live.
- Fuel and technology: Electric resistance, heat pump electric, natural gas, and propane each have different efficiency and rate profiles, so comparisons are specific to the two options being compared.
Calculating Cooktop Costs and Savings
Cooktop costs and savings are calculated by estimating how much cooking energy your household uses over a year, then pricing that energy using your local electricity and gas rates. We compare your current cooktop setup to a baseline equivalent (typically gas combustion for electric cooktops, or induction for gas/propane cooktops) using the same modeled usage so the comparison is apples-to-apples.
How We Estimate Cooktop Energy Use
We start from a baseline of 8,100 BTU/hour of useful cooking energy delivered—a representative mid-range burner output for typical household cooking. From there, we apply a household size multiplier and work backwards through the cooktop's efficiency factor to determine how much input energy is actually consumed.
- Baseline delivered energy: 8,100 BTU/hour of useful cooking output, representing typical active cooking intensity across one or more burners.
- Cooking efficiency factor: Each cooktop method converts input energy to useful cooking heat at a different rate. Gas and propane combustion cooktops are rated at 40% efficiency; electric coil at 70%; electric radiant at 76%; electric induction at 84%; and battery induction at 81%. A lower efficiency means more input energy is required to deliver the same cooking output.
- Input energy per hour:
Input BTU/hour = Delivered BTU/hour × Household multiplier ÷ Efficiency factor - Daily and annual usage: You enter meals per week; we treat each meal as about 30 minutes of active cooktop time (÷ 7 for daily hours, × 365 for annual).
Household Multiplier (Why Household Size Isn't Linear)
We apply a household size multiplier to reflect general trends seen in residential energy surveys (such as RECS), where cooking energy use rises with household size but shows diminishing returns as more occupants share meals and cooking activity. The multipliers are: 1 person 0.85×, 2 people 0.95×, 3 people 1.0× (baseline), 4 people 1.05×, 5 people 1.1×, and 6 or more 1.15×.
If you don't provide a custom meals-per-week value, we seed a default from your household size (each meal ≈ 30 min active cooktop time): 1 person → 4 meals/week, 2 people → 6, 3–4 people → 8, 5 people → 10, and 6+ people → 12. These defaults can always be overridden with your actual usage.
Electric Cooktop Costs
For electric cooktops, modeled input BTU/day is converted to kWh using the standard conversion (1 kWh = 3,412 BTU), then priced at your local electricity rate.
Formula:
kWh per day = Input BTU per day ÷ 3,412
Cost per day:
Daily cost = kWh per day × Electricity rate per kWh
Example (induction, 3-person household, 8 meals/week):
Delivered BTU/hr = 8,100 × 1.0 = 8,100 BTU/hr
Input BTU/hr = 8,100 ÷ 0.84 ≈ 9,643 BTU/hr
Input BTU/day = 9,643 × (4 ÷ 7) ≈ 5,510 BTU/day
kWh/day = 5,510 ÷ 3,412 ≈ 1.61 kWh/day
At $0.15/kWh → ≈ $0.24 per day
Gas & Propane Cooktop Costs
For natural gas and propane cooktops, input BTU/day is converted to therms (1 therm = 100,000 BTU) and priced at your local gas rate.
Formula:
Therms per day = Input BTU per day ÷ 100,000
Cost per day:
Daily cost = Therms per day × Gas rate per therm
Example (natural gas combustion, 3-person household, 8 meals/week):
Delivered BTU/hr = 8,100 × 1.0 = 8,100 BTU/hr
Input BTU/hr = 8,100 ÷ 0.40 = 20,250 BTU/hr
Input BTU/day = 20,250 × (4 ÷ 7) ≈ 11,571 BTU/day
Therms/day = 11,571 ÷ 100,000 ≈ 0.116 therms/day
At $1.50/therm → ≈ $0.17 per day
Annual Cost and Savings
Annual cost is calculated by scaling daily cost over a full year. Savings are the difference between the comparison cooktop's annual cost and your cooktop's annual cost.
Formula:
Annual cost = Daily cost × 365
Savings:
Annual savings = Comparison cooktop annual cost − Your cooktop annual cost
For electric cooktops the default comparison is a natural gas combustion cooktop; for gas and propane cooktops the default comparison is an electric induction cooktop. A positive value means your current cooktop is cheaper to run; a negative value means the comparison would cost less at your local rates.
Key Factors
- Fuel rates: Local electricity and gas prices are often the single biggest driver of which option comes out ahead.
- Cooktop method: Induction (84%) is meaningfully more efficient than radiant (76%) or coil (70%), and all electric methods significantly outperform gas combustion (40%) on a delivered-heat basis.
- Usage intensity: More meals per week (more active cooktop time) increases absolute annual cost and scales potential savings or extra cost proportionally.
- Household size: Occupants drive both the default meals-per-week seed and the household multiplier applied to baseline output.
Calculating Oven Costs and Savings
Oven costs and savings are calculated by estimating how much energy your oven uses per cooking session, then pricing that energy at your local rates and scaling by how often you cook. We compare your current oven to a baseline alternative—typically a natural gas oven for electric primaries, or an electric convection oven for gas and propane primaries—using the same modeled usage so the comparison is apples-to-apples.
How We Estimate Oven Energy Use
Rather than modeling wattage or BTU output over a fixed time window, we work from a baseline of useful cooking energy delivered per typical session. A standard oven session delivers approximately 3,840 BTU of useful cooking energy (roughly equivalent to a 45-minute bake at moderate heat). From that baseline, we account for oven size and then work backwards through the oven's efficiency to determine how much input energy—electricity or gas—is actually consumed to deliver that cooking work.
- Baseline delivered energy: 3,840 BTU of useful cooking energy per session, representing a typical moderate-intensity bake.
- Oven size multiplier: Small ovens use 10% less energy per session (0.9×); standard ovens are the baseline (1.0×); large ovens use 10% more (1.1×). This scales delivered BTU before applying efficiency.
- Cooking efficiency factor: Each oven type converts input energy to useful cooking heat at a different rate. Gas combustion ovens are rated at 45% efficiency, electric resistance ovens at 75%, and electric convection ovens at 82%. A lower efficiency means more input energy is required to deliver the same cooking work.
- Input energy per session:
Input BTU per session = Delivered BTU per session ÷ Efficiency factor
Electric Oven Costs
For electric ovens (resistance or convection), input BTU per session is converted to kilowatt-hours using the standard conversion (1 kWh = 3,412 BTU), then priced at your local electricity rate.
Formula:
kWh per session = Input BTU per session ÷ 3,412
Cost per session:
Session cost = kWh per session × Electricity rate per kWh
Example (electric convection, standard size):
Delivered BTU = 3,840 × 1.0 = 3,840 BTU
Input BTU = 3,840 ÷ 0.82 ≈ 4,683 BTU
kWh per session = 4,683 ÷ 3,412 ≈ 1.37 kWh
At $0.15/kWh → ≈ $0.21 per session
Gas & Propane Oven Costs
For natural gas and propane ovens, input BTU per session is converted to therms (1 therm = 100,000 BTU) and priced at your local gas rate.
Formula:
Therms per session = Input BTU per session ÷ 100,000
Cost per session:
Session cost = Therms per session × Gas rate per therm
Example (natural gas combustion, standard size):
Delivered BTU = 3,840 × 1.0 = 3,840 BTU
Input BTU = 3,840 ÷ 0.45 ≈ 8,533 BTU
Therms per session = 8,533 ÷ 100,000 ≈ 0.085 therms
At $1.50/therm → ≈ $0.13 per session
Annual Cost and Savings
Annual cost is calculated by scaling per-session cost by the number of cooking sessions per year, which is derived from your indicated sessions per week.
Formula:
Sessions per year = (Sessions per week ÷ 7) × 365
Annual cost:
Annual cost = Cost per session × Sessions per year
Savings:
Annual savings = Comparison oven annual cost − Your oven annual cost
For electric ovens, the default comparison is a natural gas combustion oven. For gas or propane ovens, the default comparison is an electric convection oven—the more efficient of the two electric options. A positive savings value means your current oven is cheaper to run; a negative value means the comparison would cost less at your local rates.
Key Factors
- Oven type & efficiency: Convection ovens are meaningfully more efficient than resistance ovens, which in turn are significantly more efficient than gas combustion ovens on a delivered-heat basis.
- Oven size: Larger ovens consume proportionally more energy per session due to the greater cavity volume that must be heated.
- Sessions per week: Usage frequency directly scales annual cost—an oven used every day costs roughly 3.5× more annually than one used twice a week.
- Local energy rates: Whether electric or gas cooking is cheaper depends almost entirely on your local electricity and gas prices. The same oven can show positive or negative savings depending on the state.
- Comparison baseline: Electric ovens are compared to gas combustion; gas and propane ovens are compared to electric convection, which reflects the most commonly available efficient electric alternative.
Calculating HVAC Costs and Savings
Heating and cooling costs are estimated by modeling how much energy your home needs to stay comfortable in your climate, then converting that energy into the fuel your equipment actually uses—natural gas therms, propane or heating oil gallons, or electricity in kilowatt-hours. We compare your current heating and/or cooling setup to a realistic alternative (often an electric heat pump) using the same home size, climate, comfort profile, and usage level so the comparison is apples-to-apples. Savings follow the same convention described in Calculating Savings: Annual savings = Comparison annual cost − Your annual cost.
Step 1: How Much Heating and Cooling Does Your Home Need?
We start with your home's square footage and your state's long-term climate averages: heating degree days (HDD) and cooling degree days (CDD), both measured against a 65°F base temperature. HDD and CDD summarize how cold or hot your location is over a typical year—the more degree days, the more heating or cooling work the home needs.
- Base heating load:
Heating BTU per year = Square footage × HDD × 2.5 - Base cooling load:
Cooling BTU per year = Square footage × CDD × 2.0
State heating and cooling degree-day values are annual averages from Denkiya's state climate normals database, derived from NOAA NCEI Climate at a Glance statewide temperature normals: 1901–2020 for the contiguous United States, and 1991–2020 (population-weighted statewide values) for Hawaii and Alaska. Values use a 65°F base. They represent long-term typical climate, not weather for a single year—which keeps year-round cost estimates stable and comparable across homes in the same state.
Step 2: Adjusting for Your Home and How You Use It
The base load is then scaled to reflect your home's condition, age, how hard you run the system, and whether air is delivered through ducts or a ductless path. These multipliers apply separately to heating and cooling where relevant:
- Comfort & envelope: The comfort issues you report during setup (drafty rooms, cold floors, hard-to-cool bedrooms, and similar) map to building-envelope factors such as insulation, air sealing, windows, and ducts. More issues raise a score that increases the load (up to about 30% above baseline for homes with several comfort problems). Homes reported as “always pretty comfortable” use the baseline multiplier.
- Home age: Older homes are assumed to need slightly more energy: about 15% more for homes built before 1980, 5% more for 1980–1999, and no extra adjustment for 2000 and newer.
- Usage level: How much you rely on heating or cooling scales the load: never (0×), light use 0.3×, moderate use 0.6×, typical use 1.0×, or heavy use 1.2×. Climate season length is already included in the base load; this adjusts how hard you run the system. If you set different levels for heating vs. cooling, each limb uses its own multiplier.
- Distribution type: Central ducted systems are modeled with a small additional distribution loss (1.05×); ductless mini-splits and similar non-ducted paths use 1.0×. If distribution is unknown, we use a middle value (1.03×).
Adjusted load: Adjusted BTU = Base BTU × Envelope multiplier × Home-age multiplier × Usage multiplier × Distribution multiplier
Step 3: Equipment Efficiency (AFUE and COP)
The adjusted BTU load tells us how much useful heat or cooling the home needs. Your equipment must consume more input energy to deliver that output, depending on type and age. We convert adjusted BTU into annual fuel use using equipment-appropriate efficiency metrics:
- Combustion heating (natural gas, propane, heating oil): Annual fuel use is based on AFUE (Annual Fuel Utilization Efficiency), the share of fuel energy delivered as heat. Higher AFUE means fewer therms or gallons for the same comfort.
Therms per year = Adjusted heating BTU ÷ (AFUE × 100,000)for natural gas; propane and heating oil use the same idea with gallons and their BTU content per gallon. - Electric resistance heating: Modeled at COP 1.0 (one unit of electricity in for one unit of heat out at the equipment).
- Heat pump heating: Uses COP (coefficient of performance)—how many units of heat are delivered per unit of electricity. A COP of 3 means roughly three BTU of heat per BTU of electricity consumed.
kWh per year = Adjusted heating BTU ÷ (COP × 3,412) - Cooling (central AC or heat pump cooling): Also converted from adjusted cooling BTU to kWh using a seasonal COP for the equipment type and age. Familiar SEER ratings are related to this COP; higher efficiency means fewer kWh for the same cooling load.
Step 4: Turning Energy Use Into Dollars
Annual therms, gallons, and kWh are priced at your local rates (electricity, natural gas, propane, and heating oil as applicable—the same regional sources described in Calculating Energy Costs). When monthly rate history is available, we also build an estimated annual total by applying each month's actual rate to that month's share of annual usage, the same month-by-month approach used elsewhere in Denkiya.
For combined heating-and-cooling systems (such as a heat pump that does both), heating and cooling energy are calculated on their respective loads and efficiencies, then summed for total annual cost. Some views show heating only or cooling only when that matches the equipment you are comparing (for example, a gas furnace with a separate central AC).
What We Compare Against (Simulate & Savings)
The alternative equipment depends on what you have today and which comparison mode you choose on simulate cards:
- Most Efficient: For fossil-fuel or electric-resistance heating, the benchmark is typically a ductless heat pump at high efficiency (a strong modern mini-split class assumption), with heat pump cooling when your home has cooling. For homes that already use a heat pump, the benchmark is an even more efficient ductless heat pump configuration. Cooling-only homes may be compared to an efficient heat pump cooling alternative vs. conventional central AC.
- Similar System: Matches the comparison to your home's delivery style when practical—for example, a ducted heat pump in a ducted home vs. a ductless heat pump in a ductless home. Fossil-fuel furnaces and boilers are never compared to the same fuel again; the alternative is always an electric heat pump appropriate to the home.
On savings cards for existing electric heat pumps, you can also pick a specific comparison from a menu (such as a gas furnace or central AC) when that pairing is relevant to your question.
Savings Calculation
Savings are the difference between the comparison setup's annual cost and your primary setup's annual cost, using the same climate, square footage, comfort, and usage assumptions on both sides. Only the equipment type and efficiency change.
Formula:
Annual savings = Comparison annual cost − Your annual cost
Example (direction only): If your propane furnace costs about $900/year to heat the home and a comparable ducted heat pump would cost about $750/year at your rates, savings are about $150/year by switching (comparison minus primary). If electricity is expensive in your area, the comparison can cost more and savings will be negative—meaning staying on your current fuel is cheaper at modeled rates.
Key Factors
- Climate (HDD/CDD): Colder or hotter states move heating and cooling loads more than mild climates.
- Home size & envelope: Larger homes and comfort issues that suggest insulation or air-sealing problems increase both cost and potential savings from upgrading equipment.
- Equipment type & age: Old furnaces and low-COP heat pumps use more fuel or power for the same load than newer efficient equipment.
- Ducted vs. ductless: Affects both default efficiency curves and which heat pump style is used in “Similar System” comparisons.
- Local energy rates: The same heat pump can show savings or extra cost depending on whether electricity or gas/propane/oil is cheaper in your area.
- Usage level: Homes that run heating or cooling aggressively scale all dollar results proportionally.
Data Accuracy, Assumptions & Limitations
All calculations are based on the latest available data from the U.S. Energy Information Administration and the best available industry-standard efficiency factors. We show what the numbers say for your situation—in most places electricity saves money, but that isn't true everywhere and can shift over time as rates change. Actual costs and savings will vary based on your driving habits, usage, and local market conditions. Energy rates can vary as much as ±10–20% throughout the year. We use the most granular average data available for your area, then national averages as fallback.
Appliance usage, vehicle efficiency, annual mileage, charging habits, etc. are based on manufacturer specs, EPA estimates, representative usage patterns, or direct user input.
HVAC loads use state climate normals, home square footage, comfort-issue envelope scoring, and representative equipment efficiency bands (AFUE and seasonal COP) calibrated to DOE-certified equipment performance—not a full home energy audit or Manual J load calculation. Actual bills depend on thermostat setpoints, weather year-to-year, maintenance, and equipment condition.
These estimates are intended to provide a realistic ballpark for electrification planning purposes – they are not exact predictions. Actual costs and savings will vary based on individual circumstances, and no guarantee of accuracy is implied or guaranteed.
Back to topDefinitions
Miles Per Gallon (MPG) is a measure of how far a vehicle can travel on one gallon of fuel. It indicates the fuel efficiency of gasoline and diesel vehicles.
MCF stands for thousand cubic feet, a unit of measurement for natural gas volume. One MCF equals 1,000 cubic feet of natural gas.
Therm is a unit of heat energy equal to 100,000 British thermal units (BTUs). One MCF of natural gas contains approximately 10.37 therms of energy.
Uniform Energy Factor (UEF) is a measure of water heater efficiency that accounts for standby losses, cycling, and recovery. It represents the ratio of useful hot water energy delivered to the total energy consumed. The higher the UEF, the more efficient the unit. Heat pump and hybrid electric water heaters typically have higher UEF values than standard resistance electric or gas units.
Heating Degree Days (HDD) measure how much heating a location needs over a year relative to a base temperature (we use 65°F). Each degree-day represents one day where the average outdoor temperature was one degree below the base, summed over the season. More HDD means a colder climate and more annual heating energy for a typical home.
Cooling Degree Days (CDD) work the same way for air conditioning: they sum how far average daily temperatures rise above the base (65°F). More CDD means a hotter climate and more annual cooling energy.
Annual Fuel Utilization Efficiency (AFUE) is the standard efficiency rating for furnaces and boilers. An AFUE of 82% means that 82% of the fuel's energy becomes usable heat in the home over a typical heating season; the rest is lost up the flue or through jacket losses.
Coefficient of Performance (COP) for heat pumps is the ratio of heat delivered to electricity consumed. A seasonal COP of 3.0 means the system delivers about three units of heat for each unit of electricity on average over the heating season (and a related seasonal COP is used for cooling mode). Higher COP means lower electricity use for the same comfort.
British thermal unit (Btu) is a commonly used measure of the heat content of fuel and other energy sources. It is the amount of heat needed to raise the temperature of one pound of water by 1 degree Fahrenheit.
1 kilowatt-hour = approximately 3,400 Btu
1 cubic foot of natural gas = 1,000 Btu
1 therm of natural gas = 100,000 Btu
One gallon of gasoline = about 120,000 Btu.
kW (Kilowatt) is a unit of power equal to 1,000 watts. It measures the rate at which energy is generated or consumed at a given moment. For example, a 5 kW solar array can generate up to 5 kilowatts of power in perfect conditions and when operating at full capacity.
kWh (Kilowatt-hour) is a unit of energy equal to the amount of energy used by a 1-kilowatt device running for one hour. It is the standard unit for measuring electricity consumption and storage capacity. For example, a 10 kWh battery can store 10 kilowatt-hours of energy, and an electric vehicle with a 75 kWh battery can store 75 kilowatt-hours of energy. It is calculated as: kWh = kW × hours of use.
Watt Hours Per Mile (Wh/mile) measures how much electrical energy an electric vehicle uses to travel one mile. It indicates the energy efficiency of electric vehicles.
Miles per Kilowatt Hour (mi/kWh) measures how many miles an electric vehicle can travel on one kilowatt-hour of electricity. It is calculated as: mi/kWh = 1,000 ÷ Wh/mile. This metric is the electric vehicle equivalent of miles per gallon for gasoline vehicles.
Atmospheric lifetime describes how long it takes to restore the system to equilibrium after an increase in the concentration of a GHG in the atmosphere. Atmospheric lifetimes of GHGs range from tens to thousands of years.
Carbon dioxide equivalent is a metric measure used to compare the emissions from various GHGs based upon their global warming potential (GWP). Carbon dioxide equivalents are commonly expressed as “million metric tons of carbon dioxide equivalents (MMTCO2e).” The carbon dioxide equivalent for a gas is derived by multiplying the tons of the gas by the associated GWP, as follows:
- MTCO2e = (metric tons of a gas) × (GWP of the gas)
- MMTCO2e = (million metric tons of a gas) × (GWP of the gas)
Carbon footprint refers to the total amount of GHG that is emitted into the atmosphere each year by a person, family, building, organization, or company. A person's carbon footprint includes GHG emissions from fuel that an individual burns directly, such as by heating a home or riding in a car. It also includes GHGs that come from producing the goods or services that the individual uses, including emissions from power plants that make electricity, factories that make products, and landfills where trash is sent.
Carbon neutral means having or resulting in no net addition of carbon dioxide to the atmosphere.
Carbon sequestration is the process by which trees and plants absorb carbon dioxide, release the oxygen, and store the carbon.
Emissions inventory is an estimate of the amount of pollutants emitted into the atmosphere from major mobile, stationary, area-wide, and natural source categories over a specific period of time, such as a day or a year.
Global climate change is the observed increase in the average temperature of the Earth's atmosphere and oceans, along with other significant changes in climate (such as precipitation or wind) that last for an extended period of time. The term global climate change is often used interchangeably with the term global warming, but global climate change is preferred over global warming because it helps convey that GHG emissions may result in other changes in addition to rising temperatures.
Global warming potential (GWP) is a measure of how much heat a greenhouse gas traps in the atmosphere relative to the effects of carbon dioxide (CO2) over a specific time period, allowing for comparisons of the warming potential of different gases. GWP allows for the conversion of different GHG emissions into the same emissions unit, carbon dioxide equivalence (CO2e).
Greenhouse gas (GHG) refers to gases that absorb and emit radiation within the thermal infrared range, which is the fundamental cause of human contribution to the greenhouse effect. Although there are many GHGs, the following six are explicitly identified as being of primary concern:
- Carbon dioxide (CO2), emitted as a result of fossil fuel combustion, with contributions from cement manufacturers and other sources.
- Methane (CH4), produced through the anaerobic decomposition of waste in landfills, production and distribution of natural gas and petroleum, animal digestion and decomposition of animal wastes, coal production, and incomplete fossil fuel combustion.
- Nitrous oxide (N2O), typically generated as a result of soil cultivation practices, particularly the use of commercial and organic fertilizers, fossil fuel combustion, nitric acid production, and biomass burning.
- Hydrofluorocarbons (HFCs), used primarily as refrigerants.
- Perfluorocarbons (PFCs), originally introduced as alternatives to ozone-depleting substances and typically emitted as byproducts of industrial and manufacturing processes.
- Sulfur hexafluoride (SF6), used primarily in electrical transmission and distribution systems.
Not all GHGs equally affect global climate change. As a result, GHG emissions are commonly quantified in units of their equivalent mass of carbon dioxide (CO2e). CO2e emissions are calculated by applying the appropriate global warming potential (GWP) value to pollutant-specific emissions. GWP ranges from 1 (carbon dioxide) to 22,800 (sulfur hexafluoride). GHGs with a higher GWP have a greater global warming effect on an equivalent mass basis over a specified time frame. For example, over a 100-year time frame, one metric ton (MT) of methane has the same contribution to the greenhouse effect as approximately 25 MT of CO2 and therefore has a GWP of 25.
Greenhouse effect is the warming effect of the Earth's atmosphere. Light energy from the sun that passes through the Earth's atmosphere is absorbed by the Earth's surface and is radiated into the atmosphere as heat energy. The heat energy is then trapped by the atmosphere, creating a situation similar to that which occurs in a car with its windows rolled up. The emission of CO2 and other gases into the atmosphere increases the greenhouse effect and contributes to global warming.
Intergovernmental Panel on Climate Change (IPCC) is a scientific intergovernmental body set up by the World Meteorological Organization and the United Nations Environment Programme to provide decision-makers and others interested in climate change with an objective source of information about climate change.
Net zero GHG emissions refers to the emissions of GHGs such as carbon dioxide, methane, or nitrous oxide by a particular development or human activity being equal to or less than the amount of GHGs that are removed from the atmosphere by that development or human activity (i.e., GHG emissions ≤ GHG reductions).
Troposphere is the zone of the atmosphere characterized by water vapor, weather, winds, and decreasing temperature with increasing altitude.
Back to top